

What the Rest of 2026 Holds for Severe Weather in the U.S.
Explore the severe weather outlook for the US in 2026, covering tornadoes, hurricanes, and fire risks as conditions evolve throughout the year.
| By: Keira Maguire
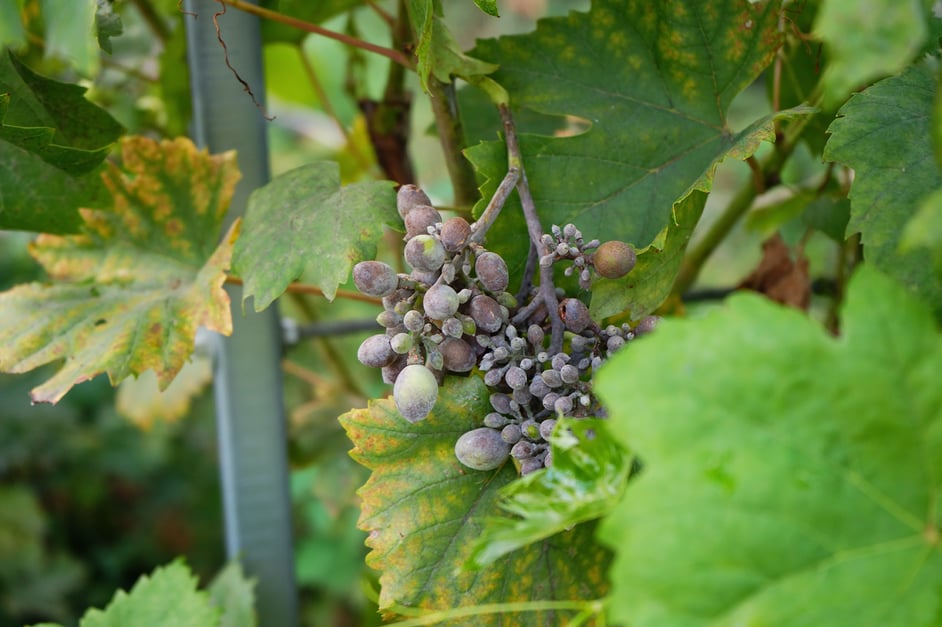
There’s a reason California growers dread the stretch from late spring into midsummer: it’s peak season for powdery mildew, a fungus that can quietly cut into both yield and quality before anyone notices it’s there.
Like many fungal diseases, it’s triggered by temperature. Powdery mildew thrives when temperatures reach mid-70s to low 80s, especially when accompanied by high humidity. Once established, it damages a crop from the outside in, diminishing external appearance, while disrupting internal processes such as transpiration and photosynthesis. By the time the damage is visible, the fungus has already been at work for several days.
Powdery mildew affects a wide range of crops across California, but no crop feels its weight quite like winegrapes. The fungus has a preference for the same warm, mediterranean-type climate that defines California’s vineyard regions. According to the Center for Wine Economics at UC Davis, California grape growers spent an estimated $176 million in 2015 fighting the disease, making powdery mildew the costliest disease to manage.
Powdery mildew is a fungal infection, and unlike many pathogens that require rain or wet leaves to spread, it only needs a narrow temperature band and humid conditions to germinate and reproduce. Sustain that window for several hours a night, several nights in a row, and a population that was negligible early in the week can multiply to infectious levels by the end of it.
Visible symptoms take time to appear, making powdery mildew a difficult pathogen to manage reactively. Visible white-gray, powdery colonies on leaves and fruit mean the infection is already established.
One measurement matters most when determining risk levels:
Air Temperature: tracked in short intervals so the station can record not just the day’s high, but the number of continuous hours spent within the preferred range.
Western Weather Group (WWG) utilizes a scale known as the Gubler-Thomas powdery mildew risk index. Think of it like a fuel gauge for disease risk, with an index that moves up and down: conditions the fungus likes pushes it higher, and unfavorable conditions bring it back down. More specifically, the model adds points when average temperatures stay in the fungus’ preferred range (75-80˚F) and subtracts points if it gets too hot (>95˚F). The model only becomes active for the season when there are three consecutive days with six or more hours within the temperature range mentioned above.
Going active. A season starts accumulating once three days each deliver 6 or more consecutive hours in the 75–80°F range, taking the index from 0 to 60.
On average this happens around April or May.
Index is capped at 100. Temperature thresholds follow the UC IPM Gubler-Thomas model.
Low index values of 0-30 indicate the pathogen is not reproducing, and that growers may consider postponing fungicide applications during extended periods with low index values. An index of 40-50 is considered moderate and signifies a powdery mildew reproductive rate of approximately 15 days. Index values of 60-100 indicate that the pathogen is reproducing rapidly, roughly every 5 days, meaning just one tiny spore on a Monday could be producing millions of new spores by Saturday.
Powdery mildew is most notably defined by the white-gray splotches on the plant’s leaves, but the damage doesn’t stop at the surface. The fungus also gets in the way of how the plant transpires and photosynthesizes.
Evapotranspiration: Leaves release water vapor through tiny pores, known as stomatal openings, and mildew growing over those pores throws that process off balance. As the infection progresses, the plant tissues begin to wilt and die, causing leaves to lose their capacity to hold water.
Photosynthesis: Fungus covering the leaf’s surface blocks light from reaching the plant and obstructs those same openings the plant needs to draw in carbon dioxide. This leaves the plant with less energy to grow and ripen fruit.
WWG provides growers with the information they need to know when spraying is actually effective against powdery mildew. WWG agriculture stations track air temperature continuously, watching for two things: how many hours the canopy spends in that 75-80˚F range, and any stretch where temperatures climb above 95˚F. Rather than just reporting daily highs and lows, the station is keeping a running tally of time spent in each of those zones to show the accumulation of favorable conditions over time.
That data feeds directly into the powdery mildew risk index. Growers can watch how the index progresses daily, giving them a clear read on whether their vineyard is at risk without having to guess. This lets the grower know how the fungus will reproduce and how often they should be spraying.
| Risk index | Pathogen status | Biologicals & SARs | Sulfur | DMIs | Strobilurins & quinolines |
|---|---|---|---|---|---|
|
0–30
Low |
Present, not reproducing | 7–14 days | 14–21 days | 21 days or label | 21 days or label |
|
40–50
Moderate |
Reproduces every 15 days | 7 days | 10–17 days | 21 days | 21 days |
|
60+
High |
Reproduces every 5 days | Not recommended | 7 days | 10–14 days | 14 days |
SARs = systemic acquired resistance activators. DMIs = demethylation inhibitors. Always follow label rates and rotate modes of action to manage resistance.
Source: UC Davis Powdery Mildew Risk Index
Instead of spraying on a fixed interval regardless of conditions, a grower can time applications when the index reaches its moderate to severe status. There are suggested spray intervals by fungicide groups based on disease pressure using the powdery mildew risk model WWG uses. This allows growers to know when it’s safe to lay off on the fungicides, and when it is necessary to use them. Knowing when and how much to spray doesn’t prevent powdery mildew from showing up in the first place, but it gives growers a much better chance at catching it before it spreads.
Even within a single county, powdery mildew risk can vary significantly. Napa is a clear example of just how much local risk conditions can diverge over a matter of miles and elevation differences.
In Northern Napa County, a stretch of warmer temperatures reset the index back to zero at the end of July once temperatures moved outside the fungus’ preferred growing range. Elevation told a similar story with vineyards in Mt. Veeder sitting above the inversion layer, keeping temperatures warm overnight and taking away the opportunity for powdery mildew to spread.
In the lower Napa Valley, locations such as Carneros experienced the bay’s cooling effect in early July, keeping temperatures too cold for the fungus to thrive in. However, marine layer influence isn’t constant through the season, and it can weaken when inland heat builds, which is likely what happened later in the month.
This pattern makes it clear that vineyard-wide risk assessment can miss real differences happening block by block. A vineyard spanning the valley floor and elevated terrain isn't experiencing one mildew season, it's experiencing several at once. Only asset-level data can show a grower where those differences appear.
Gubler–Thomas index by station, ordered north to south through the valley. July 1–July 30, 2026.
Powdery mildew is one of the most persistent threats California vineyards faces, not only because it’s hard to treat, but because it’s hard to see it coming. Days before those white-gray patches ever appear, the fungus is already active, quietly disrupting internal plant processes and resulting in lower yields, reduced quality, and higher costs from extra fungicide applications and labor.
On the upside, powdery mildew spread is driven by conditions that can be measured. WWG’s ag stations track the temperature patterns that drive the fungus’ reproduction cycle and feed that data into a running risk index. This provides growers with a clear, current read on where their vineyard stands in terms of disease pressure. When used consistently, that index translates into a detailed spraying schedule that helps growers know which fungicides to use and when to use them.
Sources:
Utilities
Explore the severe weather outlook for the US in 2026, covering tornadoes, hurricanes, and fire risks as conditions evolve throughout the year.
Agriculture
Learn how the 2026 spring freeze impacted eastern U.S. crops and discover strategies for frost risk management using asset-level weather data.
Agriculture
The forecast team at Western Weather Group analyzes the patterns of frost season and how it's affecting the west coast.