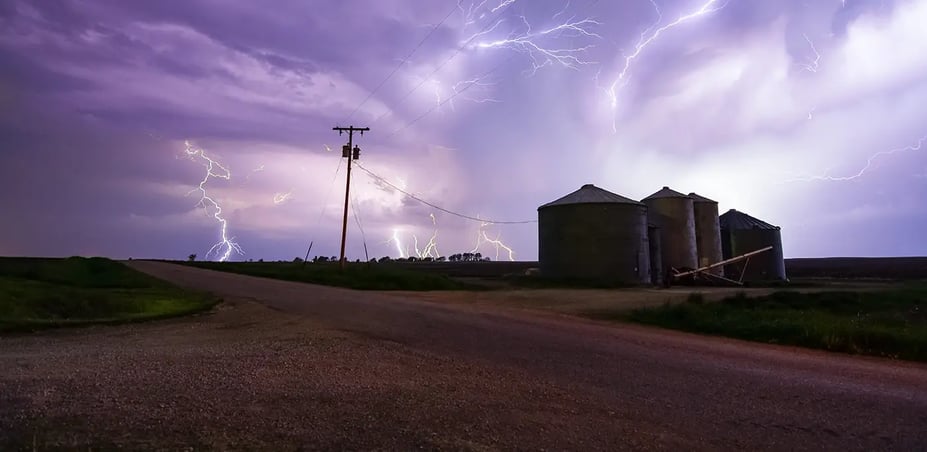
Tornado season is winding down, hurricane season is ramping up, and fire weather is already a concern out West. Here's where things stand, and what to watch for.
The U.S. has crossed the halfway point of 2026 with tornado season already running hot, two hurricane seasons now underway, and fire weather conditions building across the West. The second half of the year is shaping up to be anything but quiet.
Here's what the data and current forecasts say about what's ahead.
Tornadoes
Above-average start, but El Niño may moderate the pace
January - April preliminary count
592
30-year average (Jan-Apr)
338
Full-year forecast
~1,225
Though peak tornado season began in March and is nearing its end, tornadoes remain possible any time conditions align. So far, 2026 has tracked above the 30-year average, driven in part by a return to ENSO-neutral conditions after the La Niña spring of 2025.
NWS data currently covers through April and remains preliminary, meaning some reports need to be verified, so the number may go down. April itself was a notably active month compared to a 30-year climatology of 1991-2020, with a preliminary number of 304 tornadoes, though the NWS may revise that figure down to as few as 197. Either way, both numbers exceed the monthly average of 182.4 tornadoes, which is itself skewed upward by a massive outbreak in April 2011 that produced 700+ tornadoes.
Across January through April, the preliminary 2026 total sits at 592, with a possible revised figure of 384. Both figures sit well above the 30-year average of 337.9, though they are consistent with reports over the last five to ten years, which has averaged roughly 500 tornadoes over the same period on average.
A lot of this activity is likely due to a return of ENSO-neutral conditions in the Pacific, which generally leads to less tornadoes when compared to a La Niña year, which are conditions that occurred in spring 2025.
U.S. Tornadoes
January–April
Final count Preliminary
So where does that leave us for the rest of 2026 in terms of tornadoes?
The original outlook called for near-normal activity overall, with an expected annual total around 1,225. With peak season largely behind us and the year-to-date count already above average, that near-normal projection is looking more like a ceiling than a midpoint. The wild card is El Niño, expected to emerge in the next month or two, which typically suppresses development somewhat and may push totals downward heading into the latter half of the year.
Hurricanes
Two basins, two very different stories
Atlantic Basin
Below normal: 55% chance
Named storms8–14
Hurricanes3–6
Major hurricanes1–3
vs.
Eastern Pacific
Above normal: 70% chance
Named storms15–22
Hurricanes9–14
Major hurricanes5–9
El Niño is the driver behind both forecasts. Warm equatorial Pacific waters fuel storm development in the west while strengthening wind shear over the Atlantic, suppressing storm formation there.
Source: NOAA 2026 Hurricane Season Outlook. Season start: Pacific May 15, Atlantic June 1. Atlantic activity as of June 9: 0 named storms. Pacific activity: 3 named storms.
Both the Atlantic and Pacific basins are now fully in it. Hurricane season officially opened on May 15 in the Pacific and June 1 in the Atlantic, and the Pacific has already made its presence known, with three named storms recorded as of June 9, 2026.
El Niño is the driving force behind both. As warm equatorial Pacific waters fuel storm development to the west, the same pattern strengthens upper-level wind shear over the Atlantic, the kind of atmospheric braking mechanism that disrupts storm formation before it can gain momentum. The result: an active Pacific season and a relatively quiet Atlantic.
NOAA's latest outlook puts the odds of a below-normal Atlantic season at roughly 55%, with 8 to 14 named storms expected, 3 to 6 reaching hurricane strength, and just 1 to 3 becoming major hurricanes. The Eastern Pacific tells the opposite story, with a 70% chance of above-normal activity, 15 to 22 named storms, 9 to 14 hurricanes, and 5 to 9 major hurricanes anticipated before the season closes.
That said, a below-normal Atlantic season doesn't mean a quiet one for utilities and grid operators along the Gulf Coast and Eastern Seaboard. It only takes one storm making landfall in the right place to stress infrastructure, disrupt supply chains, and trigger extended outages. WWG's asset-level monitoring gives utilities and grid operators the situational awareness to track conditions at the station level, not just the regional forecast cone, from the moment a system organizes through landfall and recovery.
Fire weather
Elevated potential, drought conditions, and a season that hasn't peaked yet
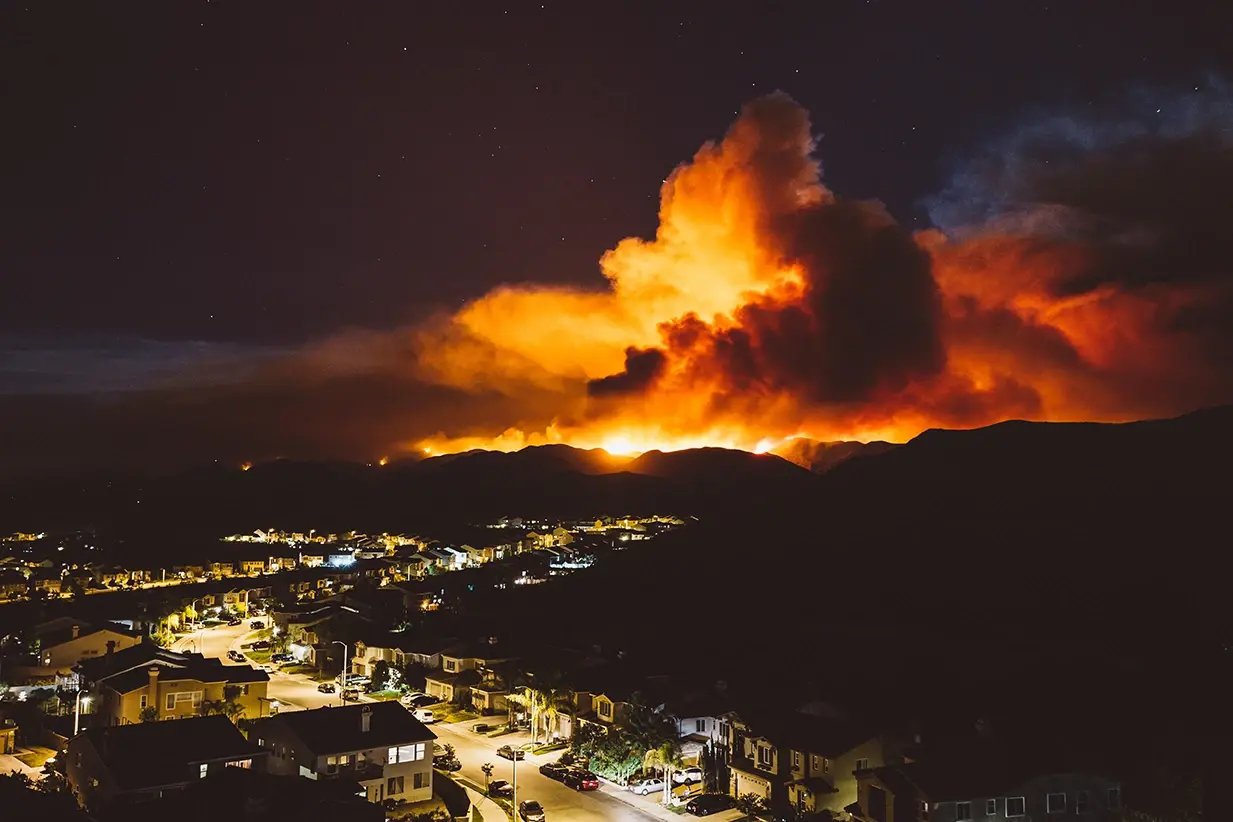
Fire weather deserves its own conversation, and the outlook for 2026 demands attention. According to the National Interagency Fire Center, much of the western U.S. is facing above-average significant fire potential through the summer, compounded by severe to exceptional drought conditions across the region. The ingredients are already in place. What's missing is the spark.
That spark doesn't require a rare event. A single hot, dry, and windy afternoon is all it takes to turn elevated potential into an active fire situation. California has already seen several "Inside Slider" systems this spring, the dry northerly wind events that have historically preceded some of the state's most damaging fire outbreaks. Those events don't announce themselves weeks in advance. The western U.S. has already logged more than 1.6 million acres burned in early 2026, more than double the 10-year average, and the peak of fire season hasn't arrived yet.
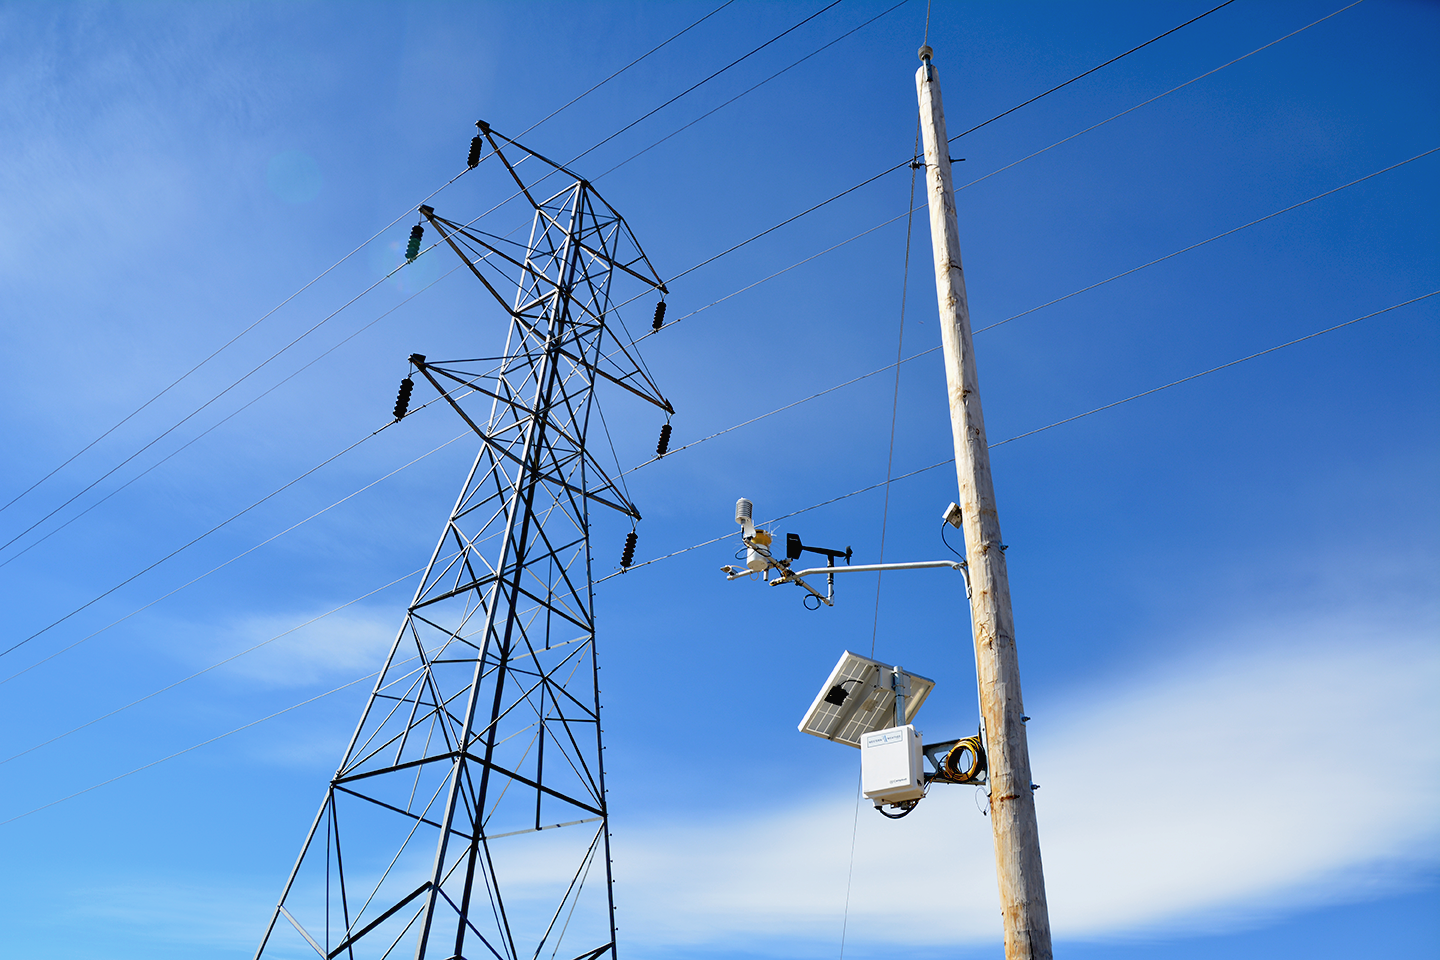
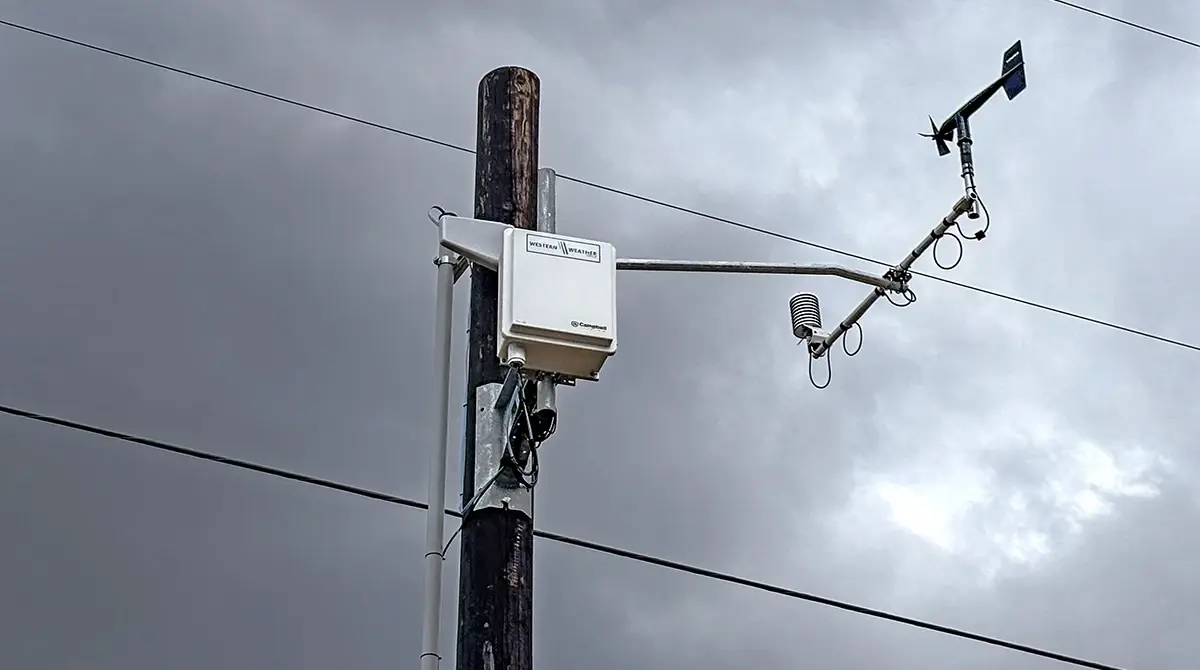
For utilities operating transmission infrastructure across fire-prone terrain, the risk isn't abstract. Ignition risk, rapid rate of spread, and the potential for forced de-energization decisions make real-time, asset-level weather data a core operational need during fire weather events, not a backup. WWG's sensor networks provide the ground-truth wind, temperature, and humidity readings that fuel fire weather assessments at the asset level, giving operators the situational awareness to make de-energization and re-energization calls with confidence rather than relying on regional forecasts that may miss localized conditions entirely.
Looking ahead
The outlooks will change. The need for situational awareness won't.
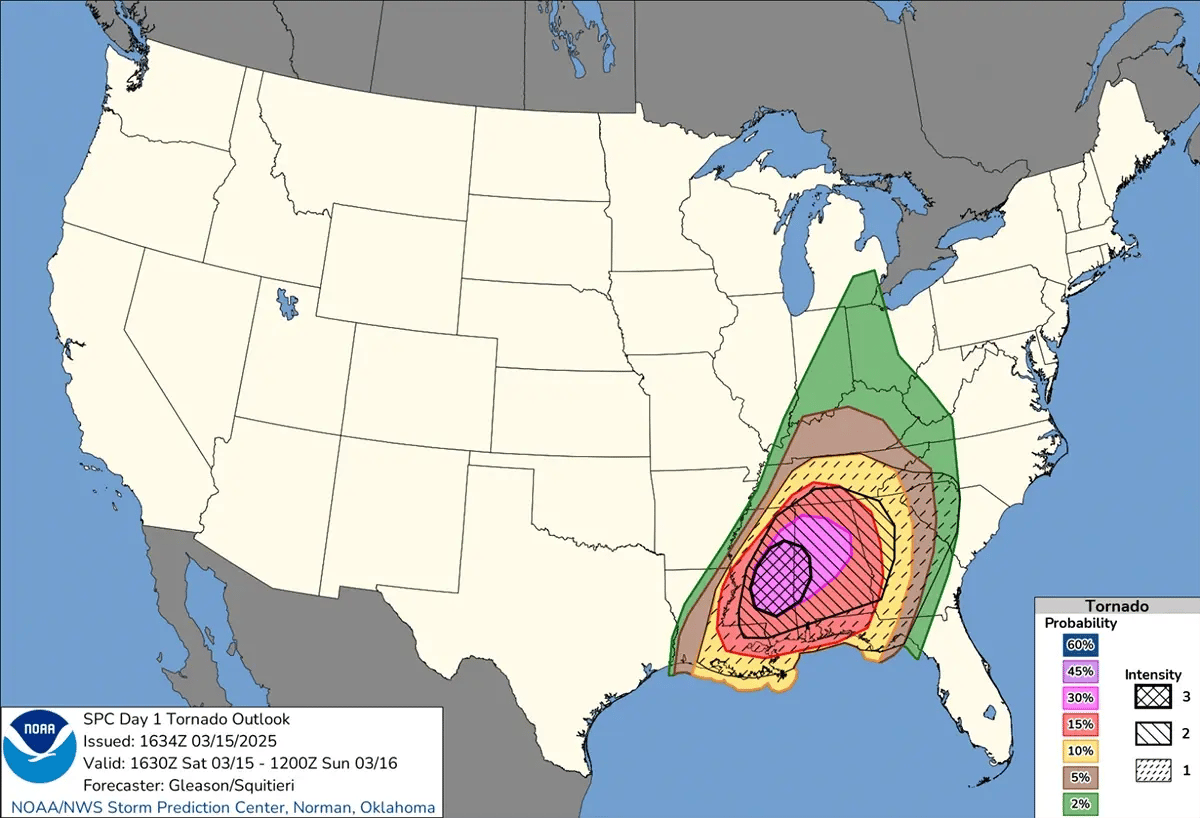
As this season progresses, two agencies provide the most reliable official guidance on what's ahead. The National Hurricane Center remains the authoritative source for tropical storm tracking and updates as the Atlantic season develops. On the severe weather side, the Storm Prediction Center recently introduced a significant update to how it communicates hazard risk: a new parameter called Conditional Intensity.
The update addresses a real gap. A 10% probability of a severe weather event doesn't tell you much if, should that event occur, the outcome is an EF4 tornado rather than a typical thunderstorm. Conditional Intensity adds that layer of context, allowing the SPC to display probabilities as low as 2% while communicating the potential severity if the event does materialize. The scale runs from 0 to 3: a rating of 0 indicates normal storm activity and won't appear on maps, while ratings of 1 through 3 are displayed in increasing accent shadings representing escalating hazard risk. In practical terms, a tornado intensity rating of 0 corresponds to a maximum of EF1 strength, while a rating of 3 signals potential for an EF4 event.
For anyone tracking severe weather risk for infrastructure or operations, this is a meaningful upgrade in forecast communication.
New: Conditional Intensities in SPC Outlooks
Key change: You no longer need a 10% or greater probability area to highlight significant severe potential.
Methodology: Intensity forecasts are now based on storm environment and storm mode.
Definition: These intensities are conditional, meaning: "If a tornado occurs, what is the probability it will be EF2/EF3/EF4?"
Less Intense More Intense
Mostly EF0-EF1
No Intensity Drawn
Max Expected EF2
Intensity Level 1
Max Expected EF3
Intensity Level 2
Max Expected EF4
Intensity Level 3
Source: NOAA Storm Prediction Center (SPC)
The forecasts are set. The conditions are building. What happens between now and the end of the year will depend heavily on how well utilities, grid operators, and growers are positioned before the next event develops, not after. WWG will continue monitoring and publishing updates as El Niño matures and its downstream effects on fall and winter weather come into focus. The outlooks will change. The need for asset-level situational awareness won't.
Are you prepared? Contact us today and we'll help you build a monitoring solution designed around your specific risks.