

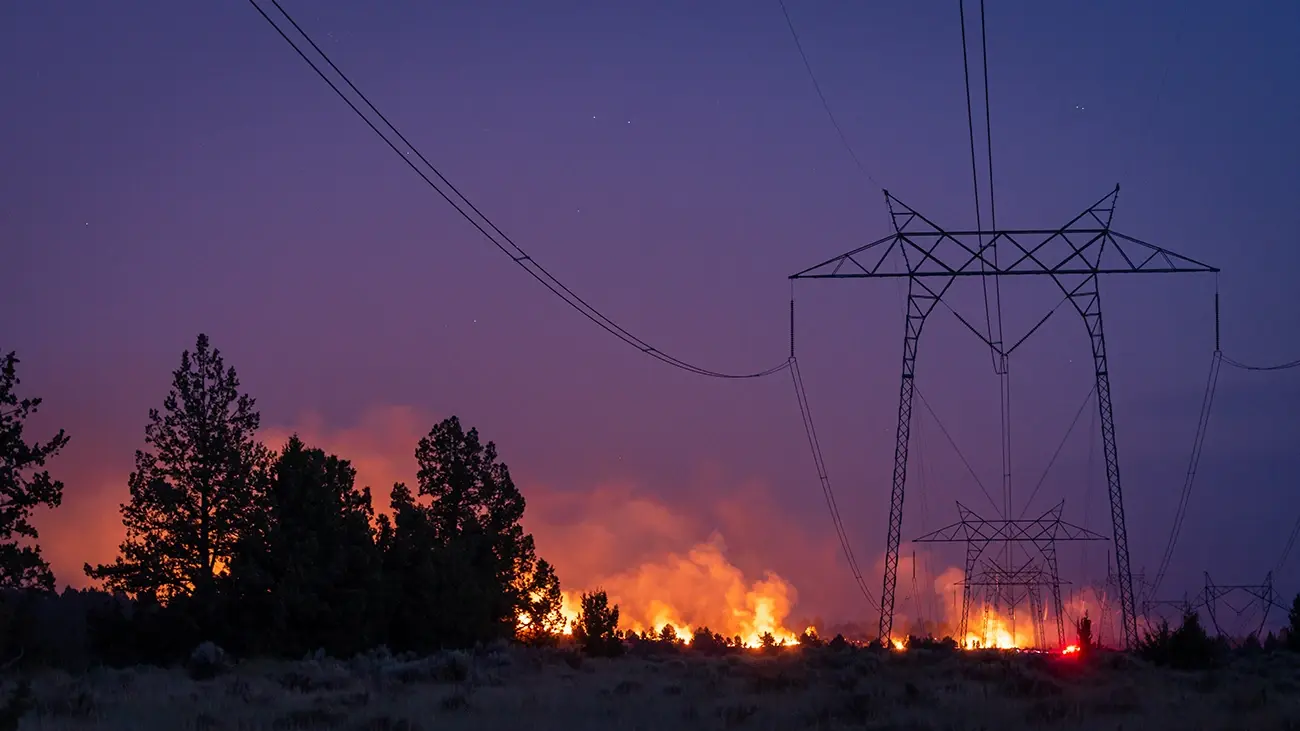
PSPS Weather Station Networks: A Utility Planning Guide
PSPS weather station networks need more than coverage. See how utilities plan station density, siting, and data flow for tighter shutoff decisions.
| By: Western Weather Group
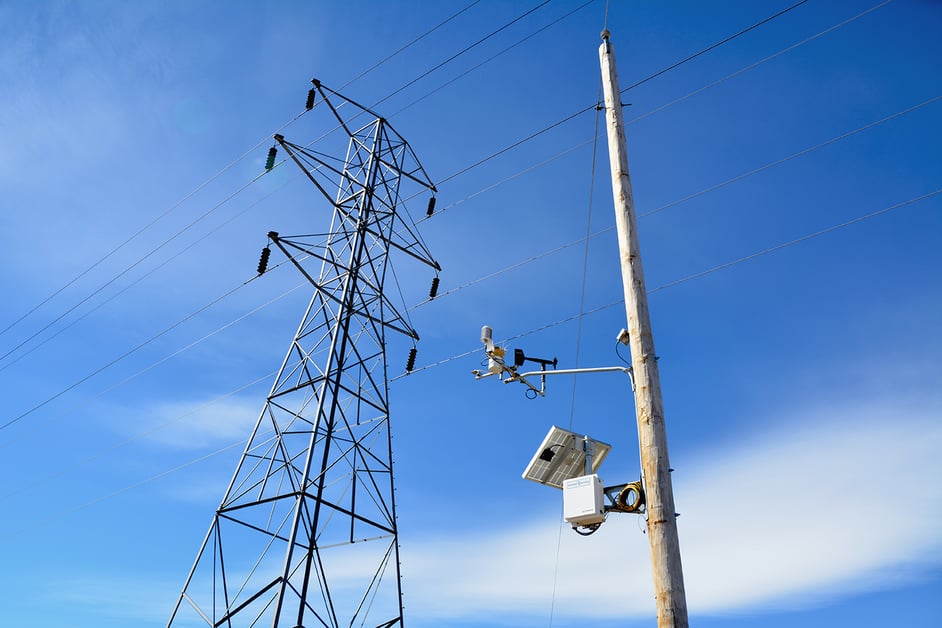
A pilot program can make a utility weather station network look simple. A handful of stations goes in, the data starts flowing, and the dashboard demonstrates initial feasibility. Then the realities of scaled deployment start.
During deployment, every placement choice affects decisions made on that circuit, every communications gap creates a blind spot, and every sensor has to hold up when the operations team is making fast calls on crew staging, patrols, or de-energization. At this point, a lot of utilities hit the same wall. Network buildout is treated like a hardware expansion, when it's really decision infrastructure the grid will depend on.
If the stations are spaced for convenience instead of by microclimates/topography, high fire tier zones and assets, or, if they're installed without a plan for calibration, failover, and workflow integration, the network can create false confidence instead of operational clarity.
In response, we designed this guide for utilities that have already proven the value of field weather data and now need to scale it into an operational system. We'll walk you through how to build a network that field teams will trust during active events and executives can defend after the fact.
Start with the circuits where weather data changes a decision: high fire risk zones, high-consequence line segments, wind-exposed ridges, canyon crossings, and the areas where crews need better field awareness during active events.
To further determine site selection, every station should answer an operational question.
If the question is "Should a crew stage closer to a high-risk span?" place the station where it represents the exposure the crew is watching.
If the question is whether conditions are approaching a de-energization threshold, place it where the weather can change faster than the control room can infer from broader data.
Terrain drives this work. Ridge tops, saddles, valley bottoms, slope breaks, and drainages can each produce different wind, humidity, and temperature conditions across short distances. A station in an easily accessible yard may be useful for maintenance, but it may not represent the line segment carrying the risk.

Good site selection also accounts for field realities. For functionality, crews need safe access, and communications need a path. The site also needs power or a dependable power plan, and sensors need proper exposure away from obstructions. The reality is that a perfect meteorological site that can't be serviced during the season becomes a weak point in the network.
For utilities planning wildfire, PSPS, and storm-response programs, Western Weather Group's utility weather monitoring work is built around this same principle. The station network should follow operational consequence, not convenience.
Station density is where a lot of network plans get too simplified. A fixed spacing rule could look clean on a map, but real-world terrain is rarely that uniform. The right density depends on circuit geometry, elevation change, exposure, vegetation, access, communications, and the consequence of missing a local condition.
In a utility weather station network, the goal isn't to cover the service territory evenly; instead, it's to reduce blind spots where the weather can change a field decision. A long, straight circuit through similar terrain may need fewer stations than a shorter circuit crossing ridges, canyons, and wind corridors.
At this stage, weather station placement for a utility should be tied to decision risk. If a blind spot sits between two low-consequence sites, it may be acceptable. But if it sits on a high-fire-risk segment where wind gusts, relative humidity, and field access matter, it needs more attention.
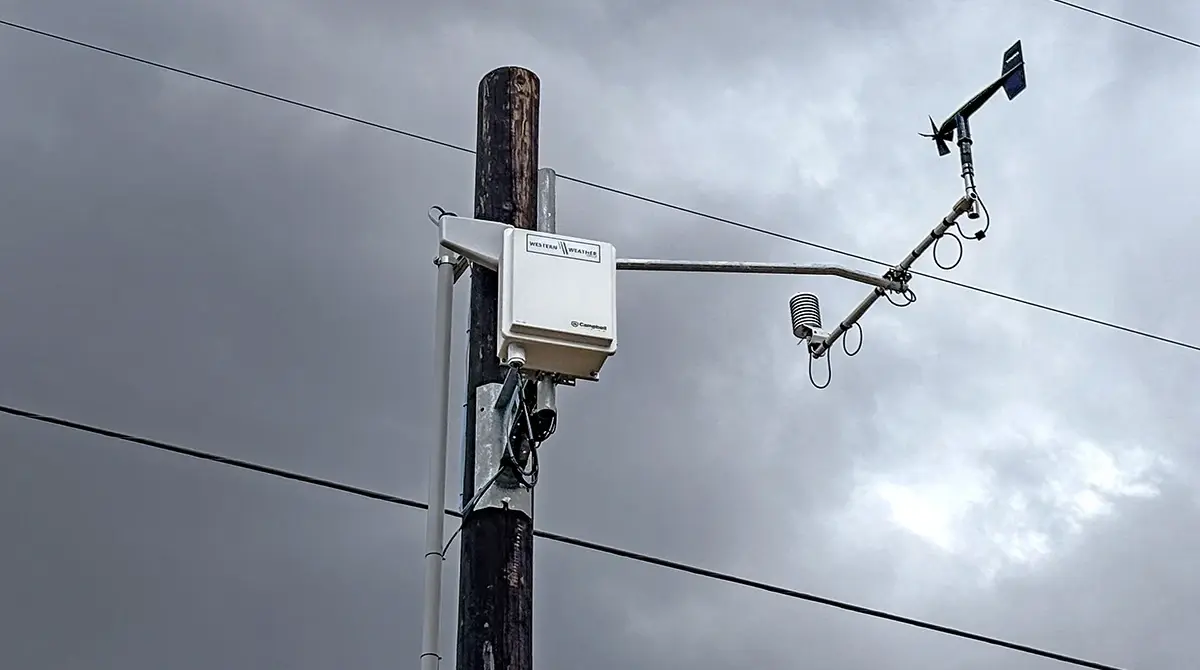
Utility stations are often installed in environments that test equipment durability. Heat, high wind, smoke, fire exposure, dust, ice, wildlife, and remote access all affect hardware performance. A consumer-grade station may produce interesting local data, but it isn't the right standard for grid operations and long-term deployment.
Start with durability and serviceability. Hardware should be built for long-term field deployment with components that can be inspected, replaced, and calibrated without reinventing the site each time a technician visits. Standardized equipment matters because a network is easier to support when crews already know the mast, enclosure, power system, communications path, and sensor suite.
The stations built by Western Weather Group incorporate professional grade dataloggers and sensors of the same class used across national weather observation networks, which gives field teams equipment that is proven, repairable, and consistent across the fleet.
Western Weather Group supports weather stations for operational monitoring, including station design, hardware selection, installation, calibration, maintenance, and long-term support under a single managed service. For a full utility deployment, hardware planning should happen before procurement locks the network into inconsistent parts and field procedures.
Sensor selection should reflect the decisions the data is intended to support. Wind speed and gusts matter for fire weather, outage exposure, and line operations. Temperature and relative humidity help frame fire-weather conditions and crew planning. Rainfall, fuel-related inputs, and other environmental measurements may matter depending on the territory and program goals.
| Measurement | Operational Use | Deployment Concern |
| Wind Speed and Gust | PSPS support, patrol timing, crew staging, fire weather awareness | Exposure, mounting height, and nearby obstructions affect trust |
| Temperature | Event context, equipment exposure, fire weather interpretation | Radiation shielding and siting quality matter |
| Relative Humidity | Fire weather awareness and threshold workflows | Sensor drift and contamination need maintenance planning |
| Rainfall or Wetting Inputs | Storm response, access planning, changing fire weather context | Debris, exposure, and inspection routines affect data quality |
A standard sensor suite doesn't mean every site has to be identical. Some sites need added measurements, while others may need a simpler configuration. The point is to standardize the base network enough that operators can compare stations with confidence.
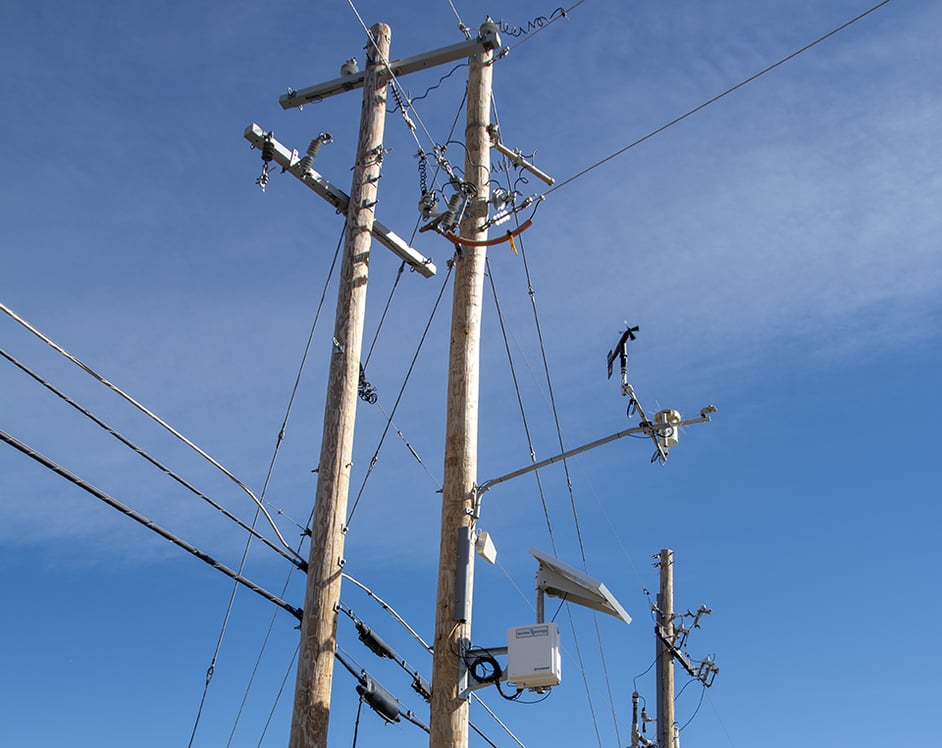
Data quality begins with installation quality. A station can have strong sensors and still produce weak data if it's mounted in the wrong exposure, placed near obstructions, or installed without repeatable documentation.
Good field deployment starts before the truck rolls. Confirm the site purpose, access route, permissions, communications path, power plan, mounting approach, and safety constraints. Field crews should know which measurement each site is meant to represent. This prevents a common failure mode where the station gets installed where it fits, instead of where it best supports the operational decision.
For future clarity and insight, document the site at install. Record the location, exposure, nearby obstructions, mounting details, sensor configuration, communications setup, and any compromises made in the field. These details matter later when operators question a reading, or a maintenance team needs to diagnose a change in performance.
Calibration is the other half of the data quality story, and it is where many networks fall short. Sensors drift over time, and a reading trusted for a de-energization or crew staging call has to hold up long after the event. WWG calibrates stations on an annual cycle and documents each calibration, so the data behind a high consequence decision can be shown to be accurate, current, and traceable rather than assumed.
Real-time weather data needs to reach the people making decisions. This sounds like a given until a high-wind event stresses communications, power, and field access at the same time. With this in mind, a grid weather monitoring deployment should be designed for the event day, not normal operating conditions.
Transmission planning starts with the site. Terrain, vegetation, distance, or local infrastructure can weaken any single connection, and the conditions that matter most (wildfire, PSPS, and severe storms) are often the same conditions that degrade local networks. The stations WWG deploys are designed to keep transmitting when a local network is stressed or down, using a resilient data path rather than depending on one connection. The right architecture depends on the territory, but the principle holds. If the site supports a high-consequence decision, the data path deserves the same scrutiny as the sensor.
Reliability also depends on knowing when the network is unhealthy. Operators shouldn't have to wonder whether a missing value means calm conditions or a failed station. Station health monitoring, data completeness checks, and clear status indicators help prevent bad assumptions during active events.
Redundancy belongs in the design phase where system resilience is defined. This may involve backup power planning, alternate transmission options, site prioritization, or escalation rules for failed stations. The right approach varies by utility, but the network needs a plan for degraded conditions.
For utilities, this data transmission connection isn't a back-office feature. It's how field observations move into the control room while decisions are still live, which is exactly what Western Weather Group's weather monitoring is designed to do: tying field data to dashboards, APIs, and network management tools.
For utilities across the U.S. facing increasing wildfire risks, Hawaiian Electric's experience offers several key takeaways:
A network becomes operational when it changes behavior. Until then, it's a data feed.
A good place to start is with the decisions field teams already make. Crews stage before events and operators watch thresholds. Patrol teams prioritize circuits. Incident teams brief leadership. Vegetation and asset teams plan their work around weather exposure. The utility sensor network should support these actions without forcing people to leave their workflow and interpret raw data under pressure.
Alerts should be clear and tied to specific actions. A threshold that triggers no response only creates noise, and a dashboard that shows every station with no decision context causes delays. An effective dashboard should do the following:
For utilities that run operational technology systems, weather data can feed directly into existing control systems using standard utility protocols, so conditions show up where operators already work instead of in a separate tool.
Forecasting adds value when it's tied to the observation network. Site-specific forecasts help teams look ahead, while station observations show what is happening now. WWG provides site-specific weather forecasting that can work alongside field observations, especially where terrain and microclimate drive local risk.
This is where scientist-led support helps. Bringing the field, data, and forecasting pieces together takes a team of meteorologists, physical scientists, and technical staff, and this mix matters when a network has to function as operating infrastructure rather than a collection of stations.
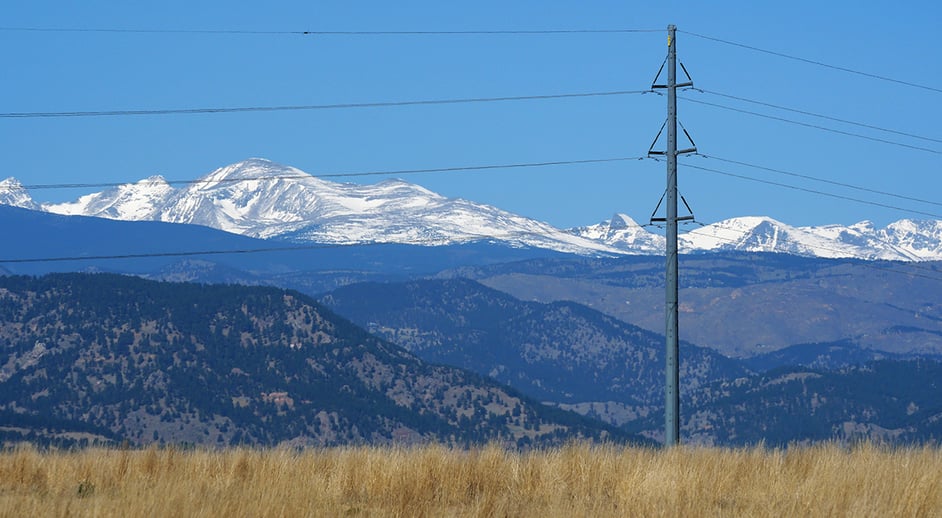
Once the network supports de-energization, crew staging, wildfire mitigation, or storm response, more stakeholders depend on it. Field operations still need fast, trusted data. Risk and executive teams need records that explain what the utility knew, when it knew it, and how the network was maintained.
An auditable utility weather station network starts with traceability. Each station should have a documented site rationale, installation record, sensor configuration, maintenance history, a traceable, defensible data record, and known outage history. If a station is used to support a high-consequence decision, the utility should be able to show why that station was trusted.
Auditability also applies to data handling. Logged observations should retain time stamps and station identity. Changes to thresholds, displays, or alert logic should be documented when they affect decision workflows. If a station fails during an event, that failure should be visible in the record rather than discovered later through missing data.
This level of documentation protects the utility from relying on memory after the fact. During an event, teams make decisions with the best data available at the time. After an event, those decisions may be reviewed by regulators, internal leadership, legal teams, or the public. A defensible record helps show the data, context, and maintenance discipline behind the action.
Talk to Western Weather Group about building a utility weather station network. For utility operations leaders, this means access to field data crews can trust when conditions are moving fast. For utility executives, it means weather intelligence built with the documentation, reliability, and traceability needed when decisions are reviewed after the fact.
Start with the circuit segments where weather changes a decision, not the sites that are easiest to reach. Good placement follows terrain, exposure, and operational consequence so the station represents the conditions crews and operators actually need to see. If a location won't help with staging, patrol, PSPS, or wildfire response, it probably doesn't belong in the first wave of deployment.
There isn't a single-spacing rule that works across every utility. Density should increase where terrain is complex, weather changes fast, or missing a local condition would change an operating call.
The biggest failures usually come from weak site selection, poor communications planning, and stations that weren't installed for long-term serviceability.
Not always. It helps to standardize the base sensor package so operators can compare stations consistently, but some sites may need added measurements based on local risk or terrain.
It depends on the sensor type, site conditions, and how critical the station is to operations. Stations in harsh environments or on high-consequence circuits usually need closer attention than low-risk sites. Our own standard is traceable, defensible data, with closer attention to stations in harsh environments or on high consequence circuits. The important part is to set a maintenance rhythm before the network goes live so that calibration is part of normal operations instead of a reactive fix.
They work best when the data is tied to a real workflow, such as crew staging, patrol prioritization, alert thresholds, or de-energization support. If the station feed doesn't change what the control room or field teams do, it's just another dashboard.
Utilities
PSPS weather station networks need more than coverage. See how utilities plan station density, siting, and data flow for tighter shutoff decisions.
Utilities
Season after season, WWG renews the training that keeps its meteorologists and technical teams ready to support utility PSPS decisions with reliable weather intelligence.
Utilities
How Liberty Utilities uses real-time data from R.M. Young and Western Weather Group to modernize vegetation management.